Written by / Researcher Chih-Chien Hou
Why Does Your Design Always Die in the Meeting Room?
Imagine a scenario: you are in a meeting room presenting a design solution that possesses both aesthetics and ingenuity, which you stayed up for several nights to complete. You feel fully confident about every detail, until the supervisor speaks up:
"Why this color? Is there data showing that this is a market trend?"
"Are our competitors doing this too? What is our differentiation from them?"
"This feature point is great, but does it really solve the problem that users care about the most?"
This scene is not unfamiliar to you and me. This is the "gap of desire" that all aspiring designers and product managers encounter on their career paths: desiring that one's professional expertise is not only seen but also adopted; desiring that one's insights can truly influence the strategic direction of products.
A New Design Thinking: Letting Data Become Your Creative Canvas
A good designer can create aesthetics, but an exceptional design strategist can confidently answer every "why" using visible data.
Modern product design has long been a powerful fusion of "creativity" and "data-driven strategy." Forrester's latest report, "The State of Design," indicates that up to 89% of design teams have incorporated "measuring the impact of design on product experience or business" into their workflows, showing that quantifying and tracking design effectiveness is becoming a norm. Industry reports from Protolabs reveal that it takes an average of about 22 months for a product to go from concept to mass production, leading over half of developers to continuously seek various ways to enhance development efficiency. This forms a huge contradiction: the market requires us to run faster and more accurately with data, but most teams still heavily rely on traditional, time-consuming market research methods—such as questionnaires, attending exhibitions, or focus group interviews—at the most critical "pre-research" stage.
We do not lack data in our hands, but we severely lack a set of tools born specifically for pre-design exploration that can quickly distill massive, chaotic market information into clear, executable design insights.

(Protolabs, 2024; Taiwan Design Research Institute, 2023; Re-drawn by this study)
For This Reason, We Created the Product Data Explorer
The “Product Data Explorer” aims to bring creativity closer to the market. We transform scattered market signals into design evidence that helps teams focus:
-
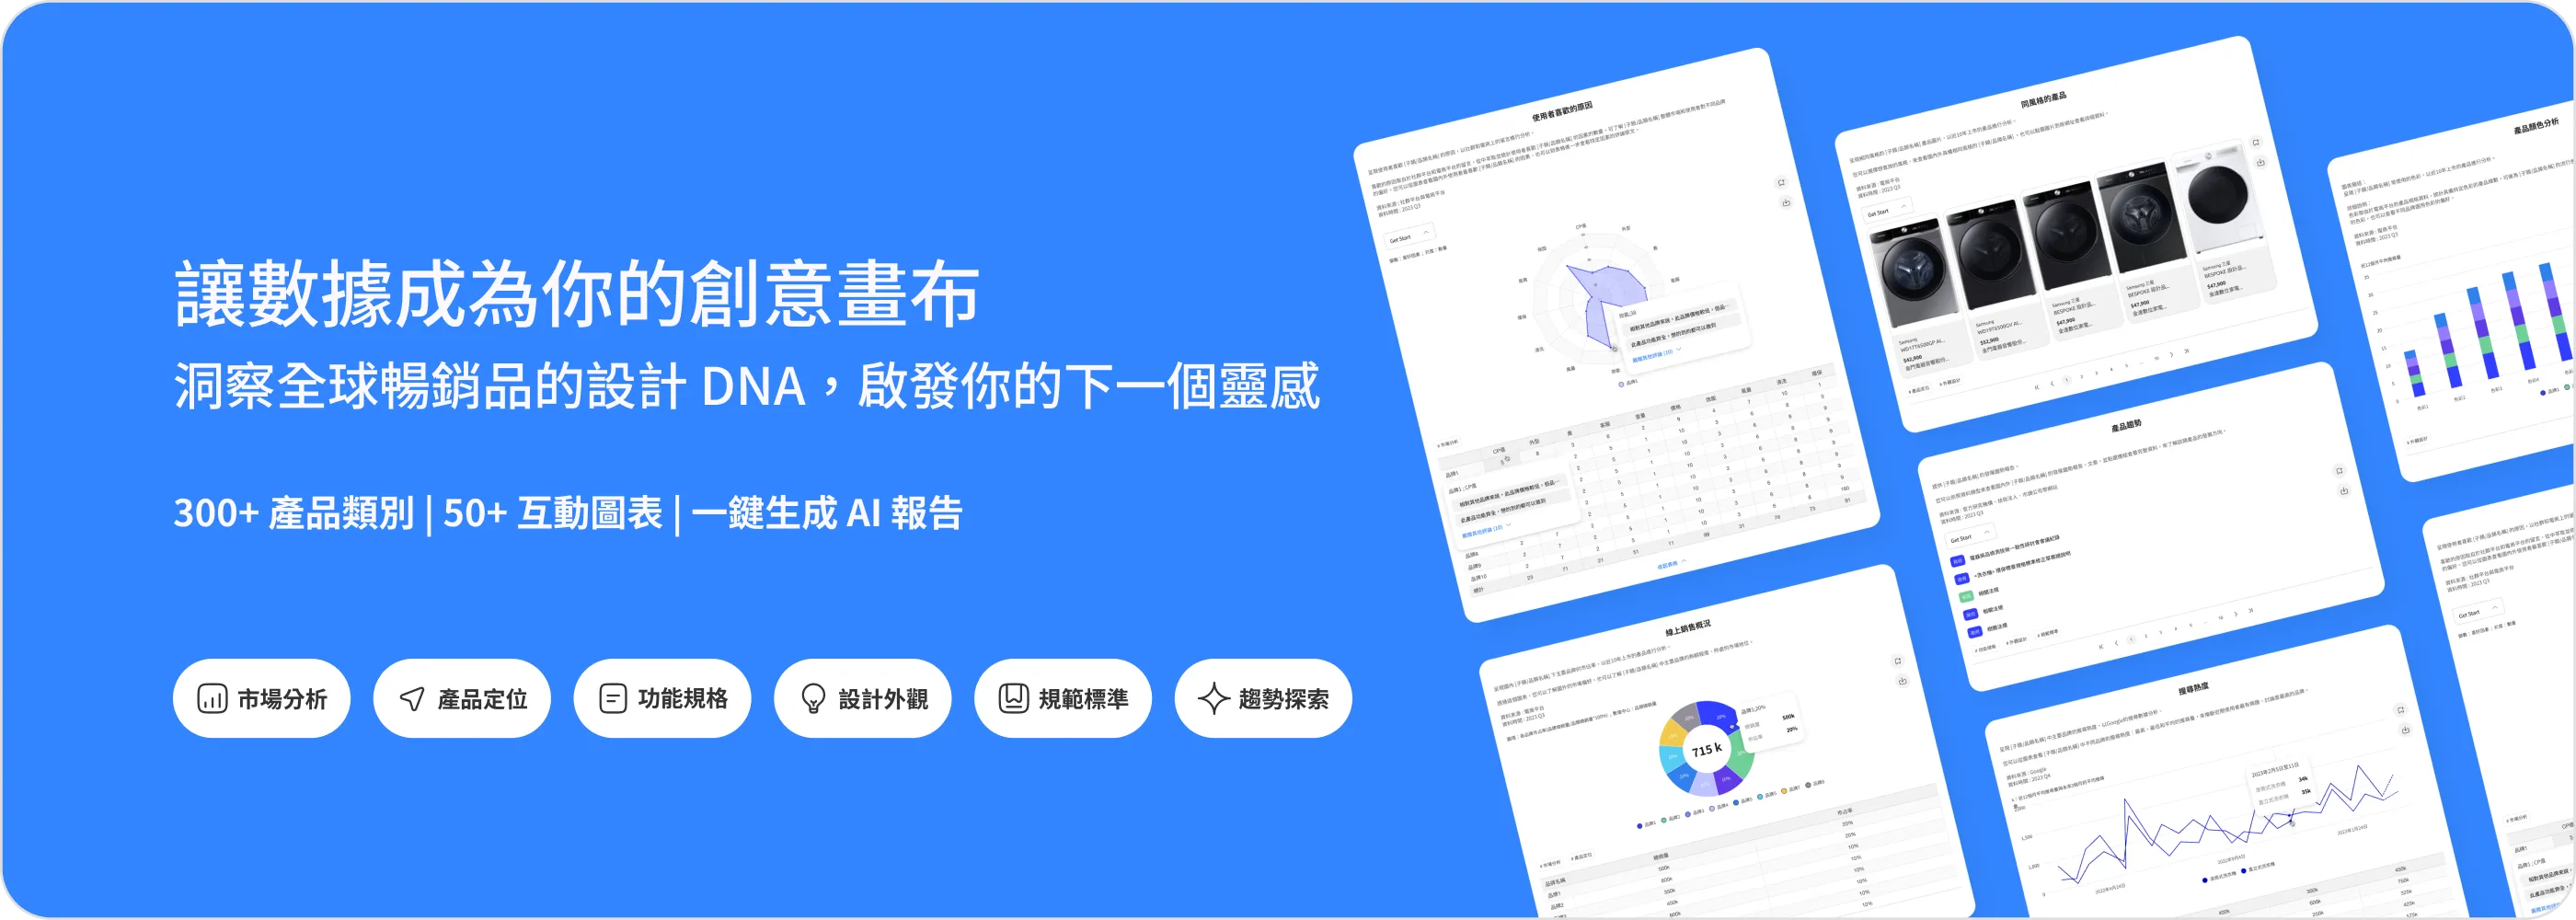
One-Stop Market Scanning: Integrates over 300 product categories and more than 100,000 pieces of domestic and international product data. You no longer need to spend several days browsing articles and cross-referencing information; in just a few minutes, you can quickly build a macro-level understanding of the market.
-
Interactive Competitor Analysis: Organizes over 50 interactive charts for each category, allowing you to deeply compare product details. Freely filter brands and cross-reference specifications to build your own project dashboard and precisely position your product's market entry point.
-
AI-Driven Design Strategy: With one click, the AI will analyze hundreds of pieces of chart specifications for you, automatically generating CMF (Color, Material, Finish) trend reports accompanied by product inspiration images. You will not only see the current market status but also obtain concrete starting points for your next strategic step.

A Practical Path from Data to Insights
We studied the workflows of design teams to deeply understand the indicators and combinations that different positions need to observe, transforming complex e-commerce data into nearly sixty charts corresponding to six major design purposes, such as "market analysis, product positioning, functional specifications, and appearance design."
This means that what you see is not noise, but intelligence that has already been endowed with meaning.
Charts: Turning Noise into Executable Discoveries
-
Task: Before a proposal, there is a need to quickly confirm the design characteristics of best-selling products.
-
How to do it: Within the selected category, click open charts such as "price, sales volume, color, material, and favorability," filter for specific brands, and add key charts to your favorites in the project.
-
What you get: Insights that can be placed directly into presentations. For example: "Among mid-to-high priced home audio-visual equipment, brands that combine metal with warm color tones receive significantly higher positive consumer evaluations compared to all-plastic materials."

Dashboards: Combining Market Opportunities That Others Didn't See
-
Task: Deeply explore the subtle correlations among competitors across different markets or design specifications.
-
How to do it: Enter the project, click "Create Dashboard," select 2-4 charts from your favorites, and the system will generate an interactively synchronized dashboard.
-
What you get: A deeper strategic map. For example, by placing "Product Price Analysis" and "Product Color Analysis" side by side, you will discover that the high-priced bicycle market is almost dominated by gray and white colors, but within the mid-priced range, "Prussian Blue" is quietly becoming a new growth driver. This discovery is your differentiation opportunity point to enter the market.

AI Trend Reports: Shifting from Insights to Executable Design Directions
-
Task: Under schedule pressures, let AI help you summarize data and find design opportunities.
-
How to do it: Click "Generate AI Trend Analysis," and the AI will read the data of that category to output trend keywords, inspiration images, popular elements, and common combinations.
-
What you get: Compressing a time-consuming exploration process into a highly efficient design guideline. The AI does not just give you scattered data points; it directly generates three product inspiration images born based on trend keywords, attached with the deployment rationale for popular colors, materials, and functions. This essentially transforms abstract discussions of "what if we try this style..." into concrete decisions of "among these three specific design directions, which one aligns better with our brand positioning?"

Equip Your Professionalism with a Data Engine
At the Taiwan Design Research Institute, we dedicate ourselves to empowering the next generation of design talents with stronger capabilities. the "Product Data Explorer" is precisely our commitment to this vision, and it will play a key role in your workflow:
-
For Designers: No longer start from a blank Figma canvas. Use the tool first to see how similar products are designed, and then decide on your differentiation route. Faced with tight schedules, let AI trend reports generate data-supported mood boards for you to accelerate consensus on proposals.
-
For Product Managers: When planning a roadmap, use data to validate the market potential of functional specifications. Upgrade assumptions of "I think users will like..." into powerful arguments of "data shows that products featuring function X achieve Y% higher sales volume."
-
For Design Supervisors or Educators: Unify team perspectives with a shared dashboard, letting discussions focus on "how to create differences" rather than arguing over "what the current market status is." Turn classrooms or internal training into a design thinking exercise based on real data.
Are you ready to base your next design on empirical evidence rather than conjecture? Enter the homepage, select a product, look at the charts, and output a report—three steps to complete your first data-driven proposal!
Registering now allows you to: fully browse all charts for one subcategory and one category, generate one AI design trend report, and favor charts as well as build projects for an unlimited number of times.
FAQ
Q1: How to get started?
Register and verify using a Google account, return to the homepage, and click Get Started; if there is a need to upgrade or purchase additional quotas, please see the plan introductions.
Q2: Data sources and coverage scope?
Focuses on four major popular design fields: smart home appliances, smart mobility, health care, and maternal and infant/children. It integrates public data from domestic and international e-commerce and review platforms in recent years, structuring real commodities into 45+ detailed attributes (such as selling price, product length, width, height, color, material, function, usage scenario, appeal, and positive/negative reviews).
👉 Reminder: Different categories are influenced by brand concentration and specification disclosures, resulting in slight differences in data density; each chart has its data scope marked to serve as a basis for interpretation, and we will continuously optimize processing methods to ensure the reliability of results.
Q3: What is the difference between a subcategory and a product category?
You can understand them as "broad" and "precise" perspectives. A subcategory (e.g., Coffee Maker) is a collection of multiple product categories, suitable for observing overall market trends; a product category (e.g., American Drip Coffee Maker) focuses on a single classification, suitable for conducting precise competitor analysis.
👉 Reminder: It might not be possible to cover all categories and brands due to source limitations; our objective is to provide flexible analysis dimensions, letting you focus better on mainstream products in the market.
Q4: What functions can the charts perform?
You can easily filter brands and specifications, switch chart styles, view data details, browse detailed tables, and add key charts to your favorites in the project to build customized dashboards. All charts and dashboards support downloading into PNG, PDF, and SVG formats, seamlessly integrating into your presentations and workflows (authorized according to plans).
Q5: Are the AI design trend reports reliable?
The AI reads structured data of that category—such as color, material, function, style, appeal, and usage scenario—to distill three major design trends, CMF combination recommendations, and related products, generating three product inspiration images to inspire your innovative thinking with data.
👉 Reminder: The reports adopt the latest AI models and are generated in combination with design thinking processes, aiming to provide high-quality inspiration and directions. We recommend utilizing them as strategic starting points to accelerate discussions and converge directions, paired with your professional judgment and verified with other research.
References:
Forrester (2025). The State Of Design: Progress And Persistent Challenges. https://www.forrester.com/blogs/the-state-of-design-progress-and-persistent-challenges
Protolabs (2024). Product Development Outlook 2024 - Innovation challenges of today and the future. https://www.protolabs.com/resources/guides-and-trend-reports/product-development-trends
Shih-Nan Lau, Yu-Chen Chen, et al. (2023). Design and Technology: Digital Transformation and Trend Analysis. Taiwan Design Research Institute.